In this section, we will focus on the basics of model validation. To build the foundation for the techniques of K-Fold and Leave-One-Out validation practiced in chapter three, we split the data into training, validation, and testing datasets, as well as develop an understanding of the bias-variance tradeoff.
This Validation Basics is part of Datacamp course: Model Validation in Python which describe about model validation as t has never been easier to implement machine learning models than it is today. The results of running new data through a model may not be as accurate as expected without proper validation. Validation of models allows analysts to answer confidently the question, “How good is your model?”. This question will be addressed for classification models using the complete set of tic-tac-toe endgame scenarios, and for regression models using fivethirtyeight’s ultimate Halloween candy power ranking dataset. The purpose of this course is to introduce the basics of model validation, to discuss various validation techniques, and to begin to develop tools for creating high-performance and validated models.
This is my learning experience of data science through DataCamp. These repository contributions are part of my learning journey through my graduate program masters of applied data sciences (MADS) at University Of Michigan, DeepLearning.AI, Coursera & DataCamp. You can find my similar articles & more stories at my medium & LinkedIn profile. I am available at kaggle & github blogs & github repos. Thank you for your motivation, support & valuable feedback.
These include projects, coursework & notebook which I learned through my data science journey. They are created for reproducible & future reference purpose only. All source code, slides or screenshot are intellactual property of respective content authors. If you find these contents beneficial, kindly consider learning subscription from DeepLearning.AI Subscription, Coursera, DataCamp
Code
import pandas as pdimport matplotlib.pyplot as pltimport seaborn as snsfrom sklearn.model_selection import train_test_splitfrom sklearn.metrics import mean_absolute_error as maefrom sklearn.ensemble import RandomForestRegressorfrom sklearn.ensemble import RandomForestClassifierimport numpy as np
Code
plt.rcParams['figure.figsize'] = (8, 8)
Creating train,test, and validation datasets
Traditional train/test split
    Seen data (used for training)
    Unseen data (unavailable for training)
# Create dummy variables using pandasX = pd.get_dummies(tic_tac_toe.iloc[:, 0:9])y = tic_tac_toe.iloc[:, 9]# Create training and testing datasets, Use 10% for the test setX_train, X_test, y_train, y_test = train_test_split(X, y, test_size=0.1, random_state=1111)
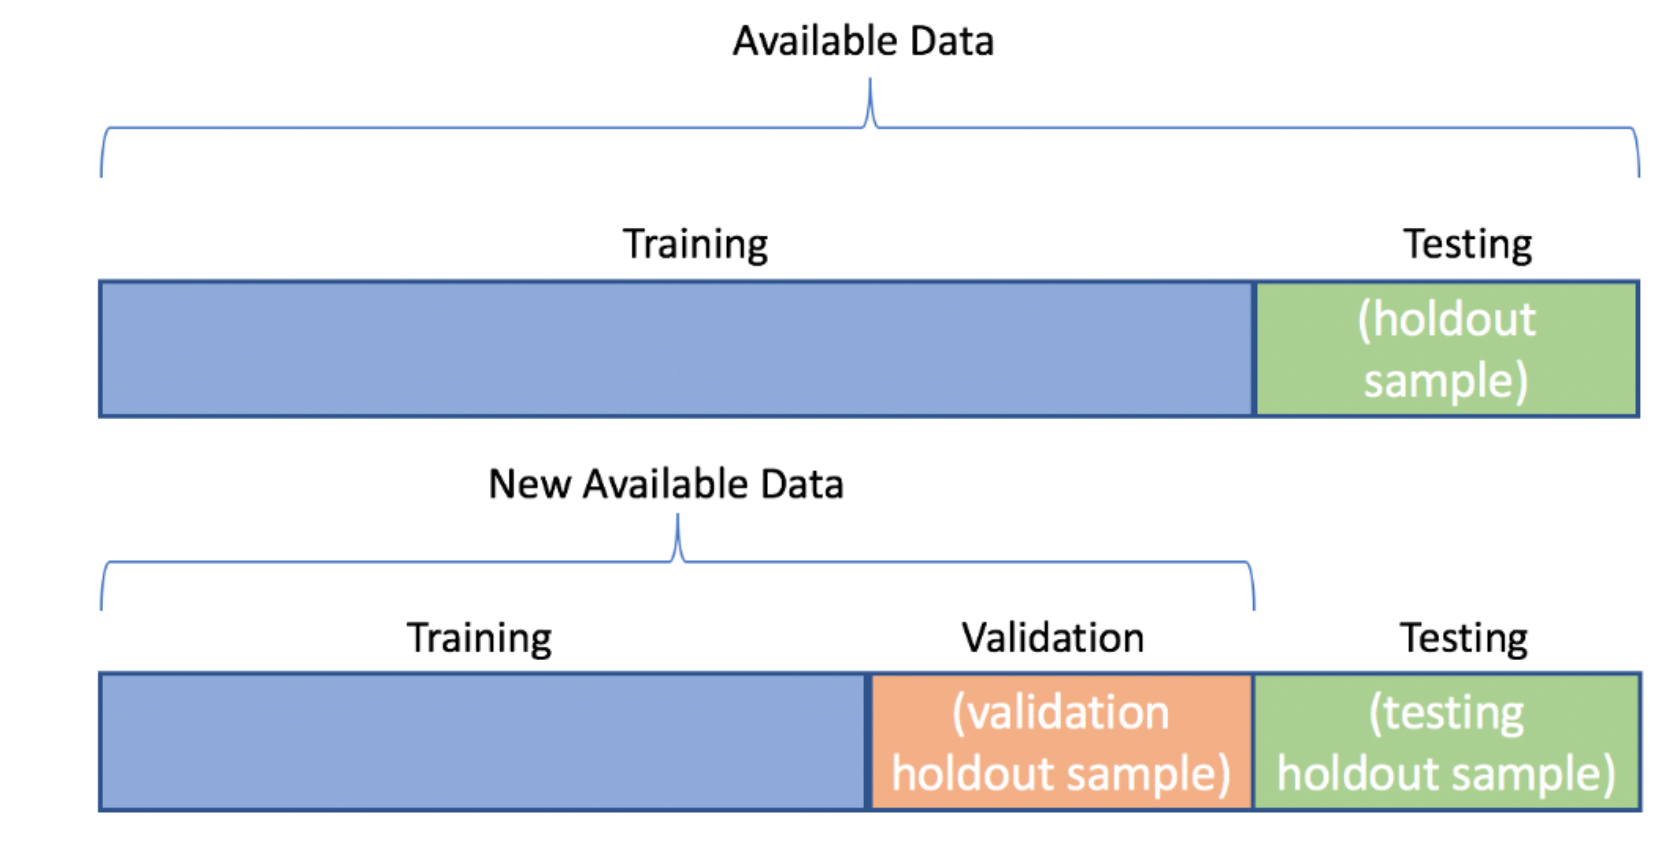
Create two holdout sets
Before you start testing different models and parameter sets, you will need to split the data into training, validation, and testing datasets. Remember that after splitting the data into training and testing datasets, the validation dataset is created by splitting the training dataset.
Code
# Create temporary training and final testing datasetsX_temp, X_test, y_temp, y_test =\ train_test_split(X, y, test_size=0.2, random_state=1111)# Create the final training and validation datasetsX_train, X_val, y_train, y_val =\ train_test_split(X_temp, y_temp, test_size=0.25, random_state=1111)
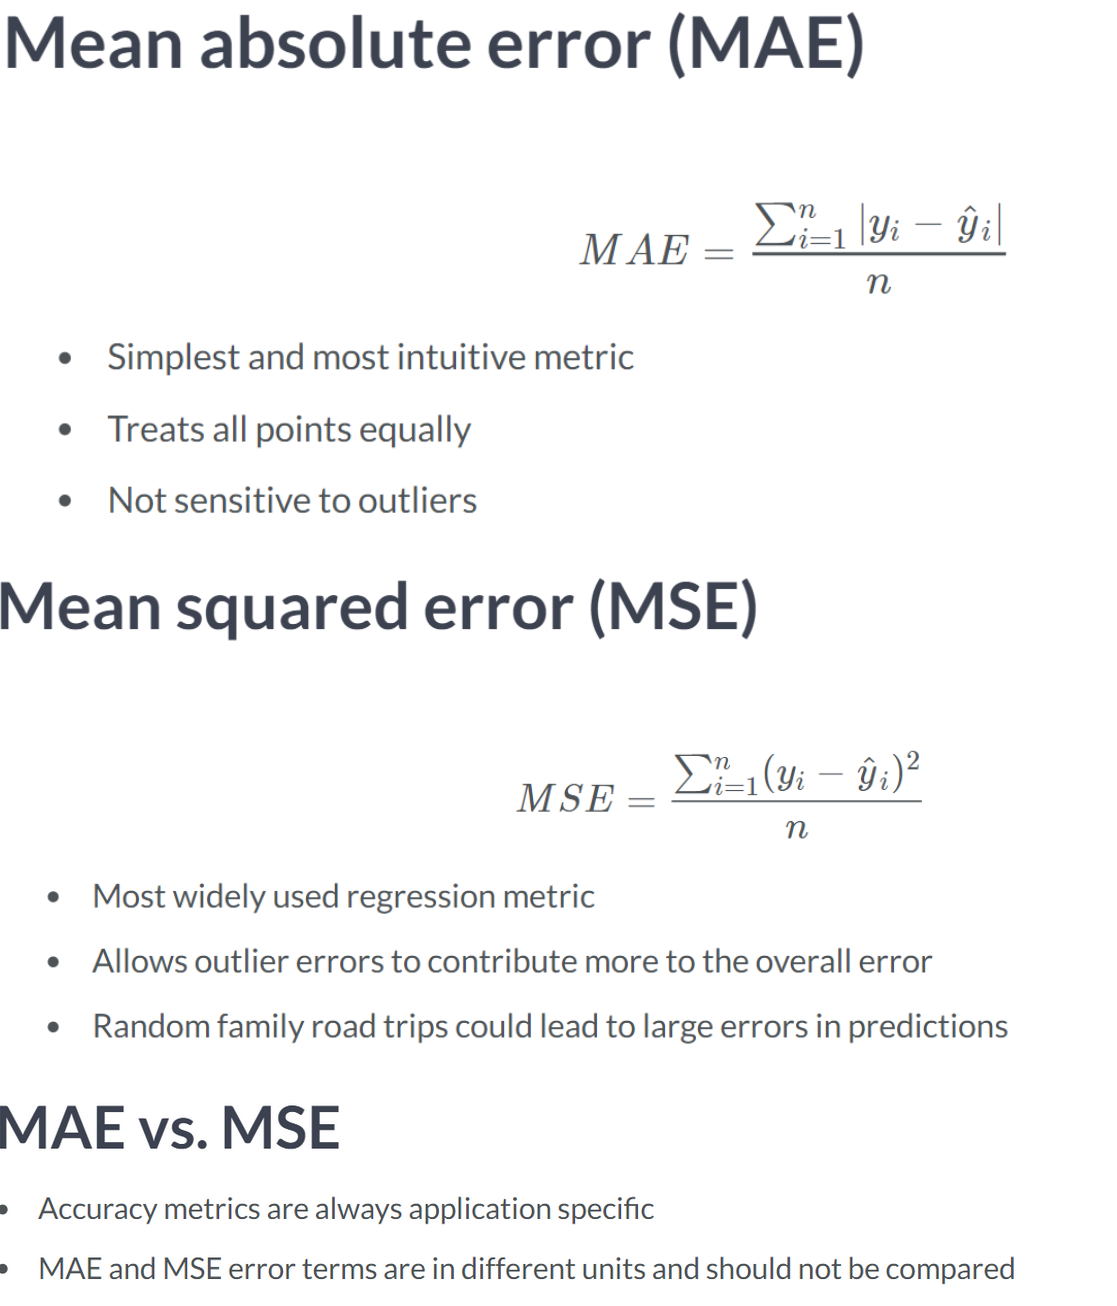
from sklearn.metrics import mean_absolute_error# Manually calculate the MAEn =len(predictions)mae_one =sum(abs(y_test - predictions)) / nprint('With a manual calculation, the error is {}'.format(mae_one))# Use scikit-learn to calculate the MAEmae_two = mean_absolute_error(y_test, predictions)print('Using scikit-learn, the error is {}'.format(mae_two))
With a manual calculation, the error is 5.9
Using scikit-learn, the error is 5.9
Mean squared error
Code
from sklearn.metrics import mean_squared_errorn =len(predictions)# Finish the manual calculation of the MSEmse_one =sum((y_test - predictions) **2) / nprint('With a manual calculation, the error is {}'.format(mse_one))# Use the scikit-learn function to calculate MSEmse_two = mean_squared_error(y_test, predictions)print('Using scikit-learn, the error is {}'.format(mse_two))
With a manual calculation, the error is 49.1
Using scikit-learn, the error is 49.1
from sklearn.metrics import mean_absolute_error as mae# Find the East conference teamseast_teams = labels =='E'# Create arrays for the true and predicted valuestrue_east = y_test[east_teams]preds_east = predictions[east_teams]west_teams = labels =='W'true_west = y_test[west_teams]preds_west = predictions[west_teams]# Print the accuracy metricsprint('The MAE for East teams is {}'.format(mae(true_east, preds_east)))# Print the west accuracyprint('The MAE for West teams is {}'.format(mae(true_west, preds_west)))
The MAE for East teams is 6.733333333333333
The MAE for West teams is 5.066666666666666
Classification metrics
Types:
    Precision
    Recall (also called sensitivity)
    Accuracy
    Specificity
    F1-score and its variations
Confusion Matrix
    True Positive: Predict/Actual are both 1
    True Negative: Predict/Actual are both 0
    False Positive: Predicted 1, actual 0
    False Negative: Predicted 0, actual 1
Confusion matrices
Confusion matrices are a great way to start exploring your model’s accuracy. They provide the values needed to calculate a wide range of metrics, including sensitivity, specificity, and the F1-score.
Code
# Calculate and print the accuracyaccuracy = (324+491) / (953)print("The overall accuracy is {0: 0.2f}".format(accuracy))# Calculate and print the precisionprecision = (491) / (491+15)print("The precision is {0: 0.2f}".format(precision))# Calculate and print the recallrecall = (491) / (491+123)print("The recall is {0: 0.2f}".format(recall))
The overall accuracy is  0.86
The precision is  0.97
The recall is  0.80
Confusion matrices, again
Creating a confusion matrix in Python is simple. The biggest challenge will be making sure you understand the orientation of the matrix. This exercise makes sure you understand the sklearn implementation of confusion matrices.
# Create dummy variables using pandasX = pd.get_dummies(tic_tac_toe.iloc[:, 0:9])y = tic_tac_toe.iloc[:, 9]y = tic_tac_toe['Class'].apply(lambda x: 1if x =='positive'else0)# Create training and testing datasets, Use 10% for the test setX_train, X_test, y_train, y_test = train_test_split(X, y, test_size=0.1, random_state=1111)
In a Jupyter environment, please rerun this cell to show the HTML representation or trust the notebook. On GitHub, the HTML representation is unable to render, please try loading this page with nbviewer.org.
from sklearn.metrics import confusion_matrix# Create predictionstest_predictions = rfc.predict(X_test)# Create and print the confusion matrixcm = confusion_matrix(y_test, test_predictions)print(cm)# Print the true positives (actual 1s that were predicted 1s)print("The number of true positives is: {}".format(cm[1, 1]))print("\nRow 1, column 1 represents the number of actual 1s that were predicted 1s (the true positives). Always make sure you understand the orientation of the confusion matrix before you start using it!")
[[28  2]
 [ 0 66]]
The number of true positives is: 66

Row 1, column 1 represents the number of actual 1s that were predicted 1s (the true positives). Always make sure you understand the orientation of the confusion matrix before you start using it!
Precision vs. recall
The accuracy metrics you use to evaluate your model should always be based on the specific application. For this example, let’s assume you are a really sore loser when it comes to playing Tic-Tac-Toe, but only when you are certain that you are going to win.
Choose the most appropriate accuracy metric, either precision or recall, to complete this example. But remember, if you think you are going to win, you better win!
Code
from sklearn.metrics import precision_score, recall_scoretest_predictions = rfc.predict(X_test)# Create precision score based on the metricp_score = precision_score(y_test, test_predictions)r_score = recall_score(y_test, test_predictions)# Print the final resultprint('The precision value is {0:.2f}, The recall value is {1:.2f}'.format(p_score, r_score))
The precision value is 0.97, The recall value is 1.00
The bias-variance tradeoff
Variance
    Following the training data too closely
    Fails to generalize to the test data
    Low training error but high test error
    Occurs when models are overfit and have high complexity
    High variance makes over-fitting
Bias
    Failing to find the relationship between the data and the response
    High training/test error
    Occurs when models are underfit
    High bias makes under-fitting
Error due to under/over-fitting
The candy dataset is prime for overfitting. With only 85 observations, if you use 20% for the testing dataset, you are losing a lot of vital data that could be used for modeling. Imagine the scenario where most of the chocolate candies ended up in the training data and very few in the holdout sample. Our model might only see that chocolate is a vital factor, but fail to find that other attributes are also important. In this exercise, you’ll explore how using too many features (columns) in a random forest model can lead to overfitting.
from sklearn.ensemble import RandomForestRegressor# Update the rfr modelrfr = RandomForestRegressor(n_estimators=25, random_state=1111, max_features=2)rfr.fit(X_train, y_train)# Print the training and test accuracyprint('The training error is {0:.2f}'.format(mae(y_train, rfr.predict(X_train))))print('The testing error is {0:.2f}'.format(mae(y_test, rfr.predict(X_test))))
The training error is 3.90
The testing error is 9.15
Code
# Update the rfr modelrfr = RandomForestRegressor(n_estimators=25, random_state=1111, max_features=11)rfr.fit(X_train, y_train)# Print the training and testing accuraciesprint('The training error is {0:.2f}'.format( mae(y_train, rfr.predict(X_train))))print('The testing error is {0:.2f}'.format( mae(y_test, rfr.predict(X_test))))
The training error is 3.59
The testing error is 10.00
Code
# Update the rfr modelrfr = RandomForestRegressor(n_estimators=25, random_state=1111, max_features=4)rfr.fit(X_train, y_train)# Print the training and testing accuraciesprint('The training error is {0:.2f}'.format( mae(y_train, rfr.predict(X_train))))print('The testing error is {0:.2f}'.format( mae(y_test, rfr.predict(X_test))))
The training error is 3.60
The testing error is 8.79
Am I underfitting?
Code
X = pd.get_dummies(tic_tac_toe.iloc[:, 0:9])y = tic_tac_toe.iloc[:, 9]y = tic_tac_toe['Class'].apply(lambda x: 1if x =='positive'else0)# Create training and testing datasets, Use 10% for the test setX_train, X_test, y_train, y_test = train_test_split(X, y, test_size=0.2, random_state=1111)
Code
from sklearn.metrics import accuracy_scoretest_scores, train_scores = [], []for i in [1, 2, 3, 4, 5, 10, 20, 50]: rfc = RandomForestClassifier(n_estimators=i, random_state=1111) rfc.fit(X_train, y_train)# Create predictions for the X_train and X_test datasets. train_predictions = rfc.predict(X_train) test_predictions = rfc.predict(X_test)# Append the accuracy score for the test and train predictions. train_scores.append(round(accuracy_score(y_train, train_predictions), 2)) test_scores.append(round(accuracy_score(y_test, test_predictions), 2))# Print the train and test scores.print("The training scores were: {}".format(train_scores))print("The testing scores were: {}".format(test_scores))print("\nNotice that with only one tree, both the train and test scores are low. As you add more trees, both errors improve. Even at 50 trees, this still might not be enough. Every time you use more trees, you achieve higher accuracy. At some point though, more trees increase training time, but do not decrease testing error.")
The training scores were: [0.94, 0.93, 0.98, 0.97, 0.99, 1.0, 1.0, 1.0]
The testing scores were: [0.83, 0.79, 0.89, 0.91, 0.91, 0.93, 0.97, 0.98]

Notice that with only one tree, both the train and test scores are low. As you add more trees, both errors improve. Even at 50 trees, this still might not be enough. Every time you use more trees, you achieve higher accuracy. At some point though, more trees increase training time, but do not decrease testing error.
Code
x = [1, 2, 3, 4, 5, 10, 20, 50]tmp = pd.DataFrame({'x':x, 'training':train_scores, 'test':test_scores})tmp.set_index('x', inplace=True)tmp.plot(title='train/test score for n_estimators');